
What It Is
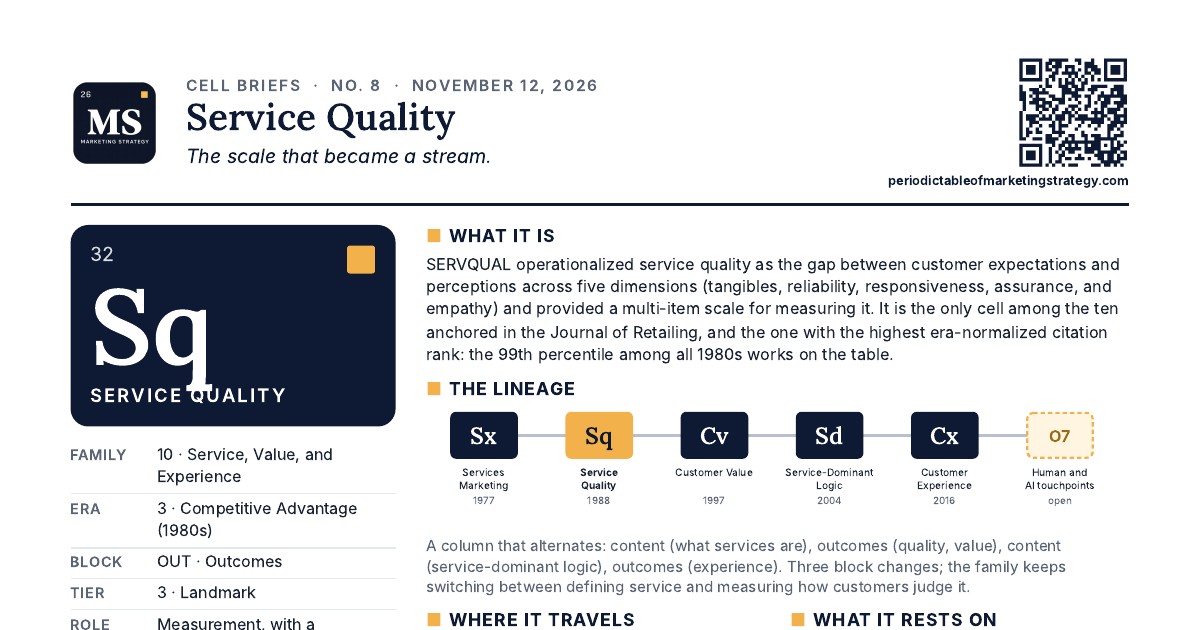
SERVQUAL operationalized service quality as the gap between customer expectations and perceptions across five dimensions (tangibles, reliability, responsiveness, assurance, and empathy) and provided a multi-item scale for measuring it. It is the only cell among the ten anchored in the Journal of Retailing, and the one with the highest era-normalized citation rank: the 99th percentile among all 1980s works on the table.
The Lineage
- Sx
Services Marketing
1977
- Sq
Service Quality
1988
- Cv
Customer Value
1997
- Sd
Service-Dominant Logic
2004
- Cx
Customer Experience
2016
- O7
Human and AI touchpoints
open
A column that alternates: content (what services are), outcomes (quality, value), content (service-dominant logic), outcomes (experience). Three block changes; the family keeps switching between defining service and measuring how customers judge it.
Where It Travels
Five curated links out: Expectancy Disconfirmation, Satisfaction Index (ACSI), Supply Chain Orientation (logistics service quality), Productivity Chain (via the service-profit chain and return on quality), and Manager-Customer Gap. Seven mentions, all in Satisfaction and Supply Chain. Its traffic is concentrated: 12 links into just three families.
What It Rests On
One curated link in, from Expectancy Disconfirmation (Ed): the gap model adopts Oliver's expectation-performance logic. The anchor cites no other anchor work on the table; SERVQUAL's reference list is psychometrics and measurement, not strategy. The cell entered the strategy corpus from outside it.
Descendants You Would Not Guess
32 anchor works in eight families cite it, 14 in the services deep dive (performance-based quality, Cronin and Taylor, 1992; hierarchical quality, Brady and Cronin, 2001; return on quality, Rust, Zahorik, and Keiningham, 1995) and eight in satisfaction. On the Core Table: Supply Chain Orientation (Mentzer, Flint, and Hult, 2001), Service-Dominant Logic (Vargo and Lusch, 2004), and Customer Experience (Lemon and Verhoef, 2016). Less expected: Technology Readiness (Parasuraman, 2000), the retail store environment (Baker, Grewal, and Parasuraman, 1994), and customer channel migration (Ansari, Mela, and Neslin, 2008).
Three Things The Cell Does Not Show
- The table's only mutual link. Of 419 documented links, one is coded as running both ways: service quality and expectancy disconfirmation. Oliver's model was built in service settings and became SERVQUAL's gap logic; the two families co-developed the construct.
- The gap model went into the warehouse. Logistics service quality, order fulfillment and loyalty, and electronic logistics service quality all adopt it. A retailing scale became the supply chain's customer measure.
- A thirteen-year argument. Its sub-lineage is a dispute about measurement: SERVQUAL (1988), performance-only SERVPERF (Cronin and Taylor, 1992), hierarchical quality (Brady and Cronin, 2001). The open position asks about the Quality of AI-delivered service (D10-O2).
Anchor Works
Cite as: Hult, G. Tomas M. (2026), “Service Quality,” Cell Briefs No. 8, The Periodic Table of Marketing Strategy.
Link counts and citing works are from the site's analysis dataset (Version 1.0). Placements, anchors, and tiers are editorial judgments; verify against the original works.
Copyright © G. Tomas M. Hult 2026