
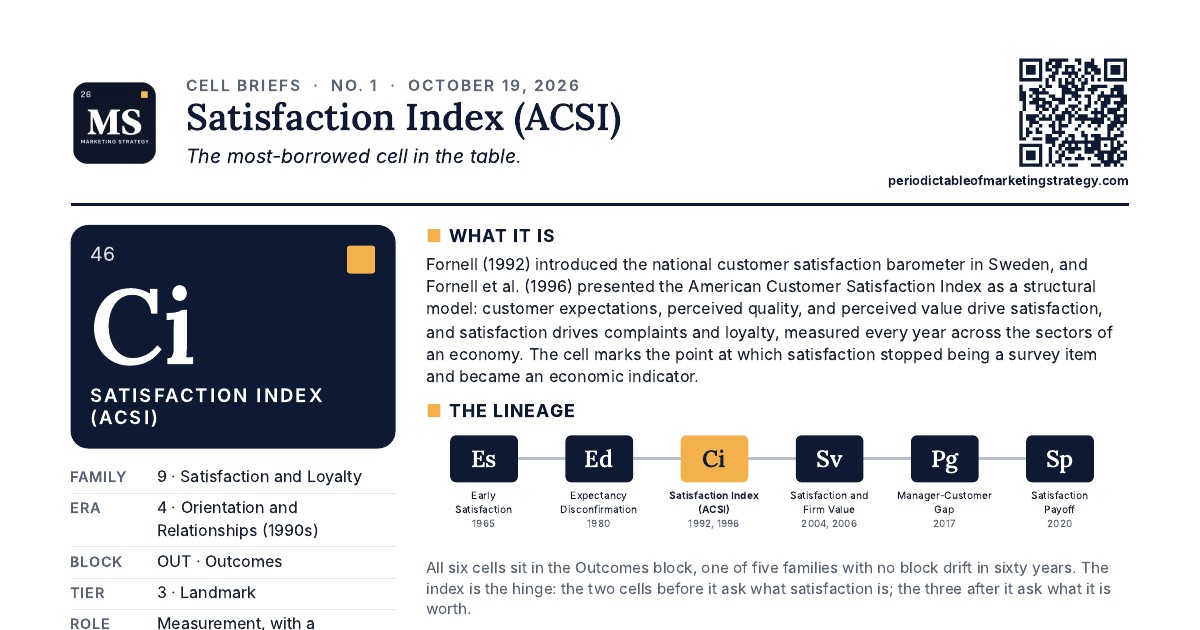
What It Is
Fornell (1992) introduced the national customer satisfaction barometer in Sweden, and Fornell et al. (1996) presented the American Customer Satisfaction Index as a structural model: customer expectations, perceived quality, and perceived value drive satisfaction, and satisfaction drives complaints and loyalty, measured every year across the sectors of an economy. The cell marks the point at which satisfaction stopped being a survey item and became an economic indicator.
The Lineage
- Es
Early Satisfaction
1965
- Ed
Expectancy Disconfirmation
1980
- Ci
Satisfaction Index (ACSI)
1992, 1996
- Sv
Satisfaction and Firm Value
2004, 2006
- Pg
Manager-Customer Gap
2017
- Sp
Satisfaction Payoff
2020
All six cells sit in the Outcomes block, one of five families with no block drift in sixty years. The index is the hinge: the two cells before it ask what satisfaction is; the three after it ask what it is worth.
Where It Travels
Four curated Core Table links carry the index into other families: CSR and Market Value (Cs), Productivity Chain (Mp), Customer Experience (Cx), and Performance Outcomes (Po). A further 29 deep-dive cells in eight families name it, from Working Relationships in Channels to Order Fulfillment and Loyalty in Supply Chain.
What It Rests On
One curated link in: Service Quality (Sq), whose quality and value constructs the index models as antecedents. Its own reference lists reach outside marketing: Hirschman's Exit, Voice, and Loyalty (1970) supplies the complaint-or-leave logic, and Porter's Competitive Strategy (1980) the idea that satisfaction is a competitive position.
Descendants You Would Not Guess
Twelve of the 26 citing anchors sit in the Satisfaction and Loyalty deep dive. The other fourteen are elsewhere: Marketing Capabilities (Vorhies and Morgan, 2005), Brand Portfolio (Morgan and Rego, 2009), CRM Process (Reinartz, Krafft, and Hoyer, 2004), Marketing and Systematic Risk (Tuli and Bharadwaj, 2009), Market-Oriented Culture (Homburg and Pflesser, 2000), and Integrative Supply Chain Strategy (Vickery et al., 2003). The index became the dependent variable for streams that never set out to study satisfaction.
Three Things The Cell Does Not Show
- A measurement that became a definition. Both anchors are coded as measurement with a secondary defining role. The family's first definitions came more than a quarter century earlier, yet it is the index that later work defines satisfaction against.
- It was born in Sweden. The 1992 anchor reports the Swedish Customer Satisfaction Barometer, the first national index, launched in 1989. The American index followed in 1994; the deep dive adds Johnson and Fornell (1991) as the theoretical bridge between the two.
- Its frontier is digital. In its Measurement and Indices sub-lineage (Hunt 1977, Westbrook 1980, ACSI, the Net Promoter debate of 2003 to 2007, replication in 2013), the open position is Satisfaction measured from digital traces (D9-O2).
Anchor Works
Cite as: Hult, G. Tomas M. (2026), “Satisfaction Index (ACSI),” Cell Briefs No. 1, The Periodic Table of Marketing Strategy.
Link counts and citing works are from the site's analysis dataset (Version 1.0). Placements, anchors, and tiers are editorial judgments; verify against the original works.
Copyright © G. Tomas M. Hult 2026